Fundraising by Start-up Businesses in the Capital Market

Author(s)
Li-Lin Liang & Chun-Ying WuBiography
Li-Lin Liang is an assistant professor at National Sun Yat-sen University, Taiwan. She obtained a PhD degree at the London School of Economics and Political Science and a Master’s degree at Imperial College London. She has published papers in such renowned journals such as Health Economics, Social Science & Medicine, and Health Policy and Planning.
Chun-Ying Wu is the Director of Biomedical Informatics of National Yang-Ming University, the Chief of Division of Translational Research, a Professor of Gastroenterology and Hepatology in Taipei Veterans General Hospital, and a joint Appointment Researcher of the National Institute of Cancer Research. He has published many papers in top journals, including JAMA.
Academy/University/Organization
National Sun Yat-sen University & National Yang-Ming UniversitySource
Covid19 mortality is negatively associated with test number and government effectiveness-
TAGS
-
Share this article
You are free to share this article under the Attribution 4.0 International license
- HUMANITIES & SOCIAL SCIENCES
- Text & Image
- January 15,2021
A core question regarding the Covid-19 pandemic is why mortality rates vary considerably across countries. This study aims to identify factors associated with cross-country variation in Covid-19 mortality rates. By retrieving data from the Worldometer, Worldwide Governance Indicators, World Development Indicators and Logistics Performance Indicators databases, we analyzed 7.8 million Covid-19 patients in 169 countries.
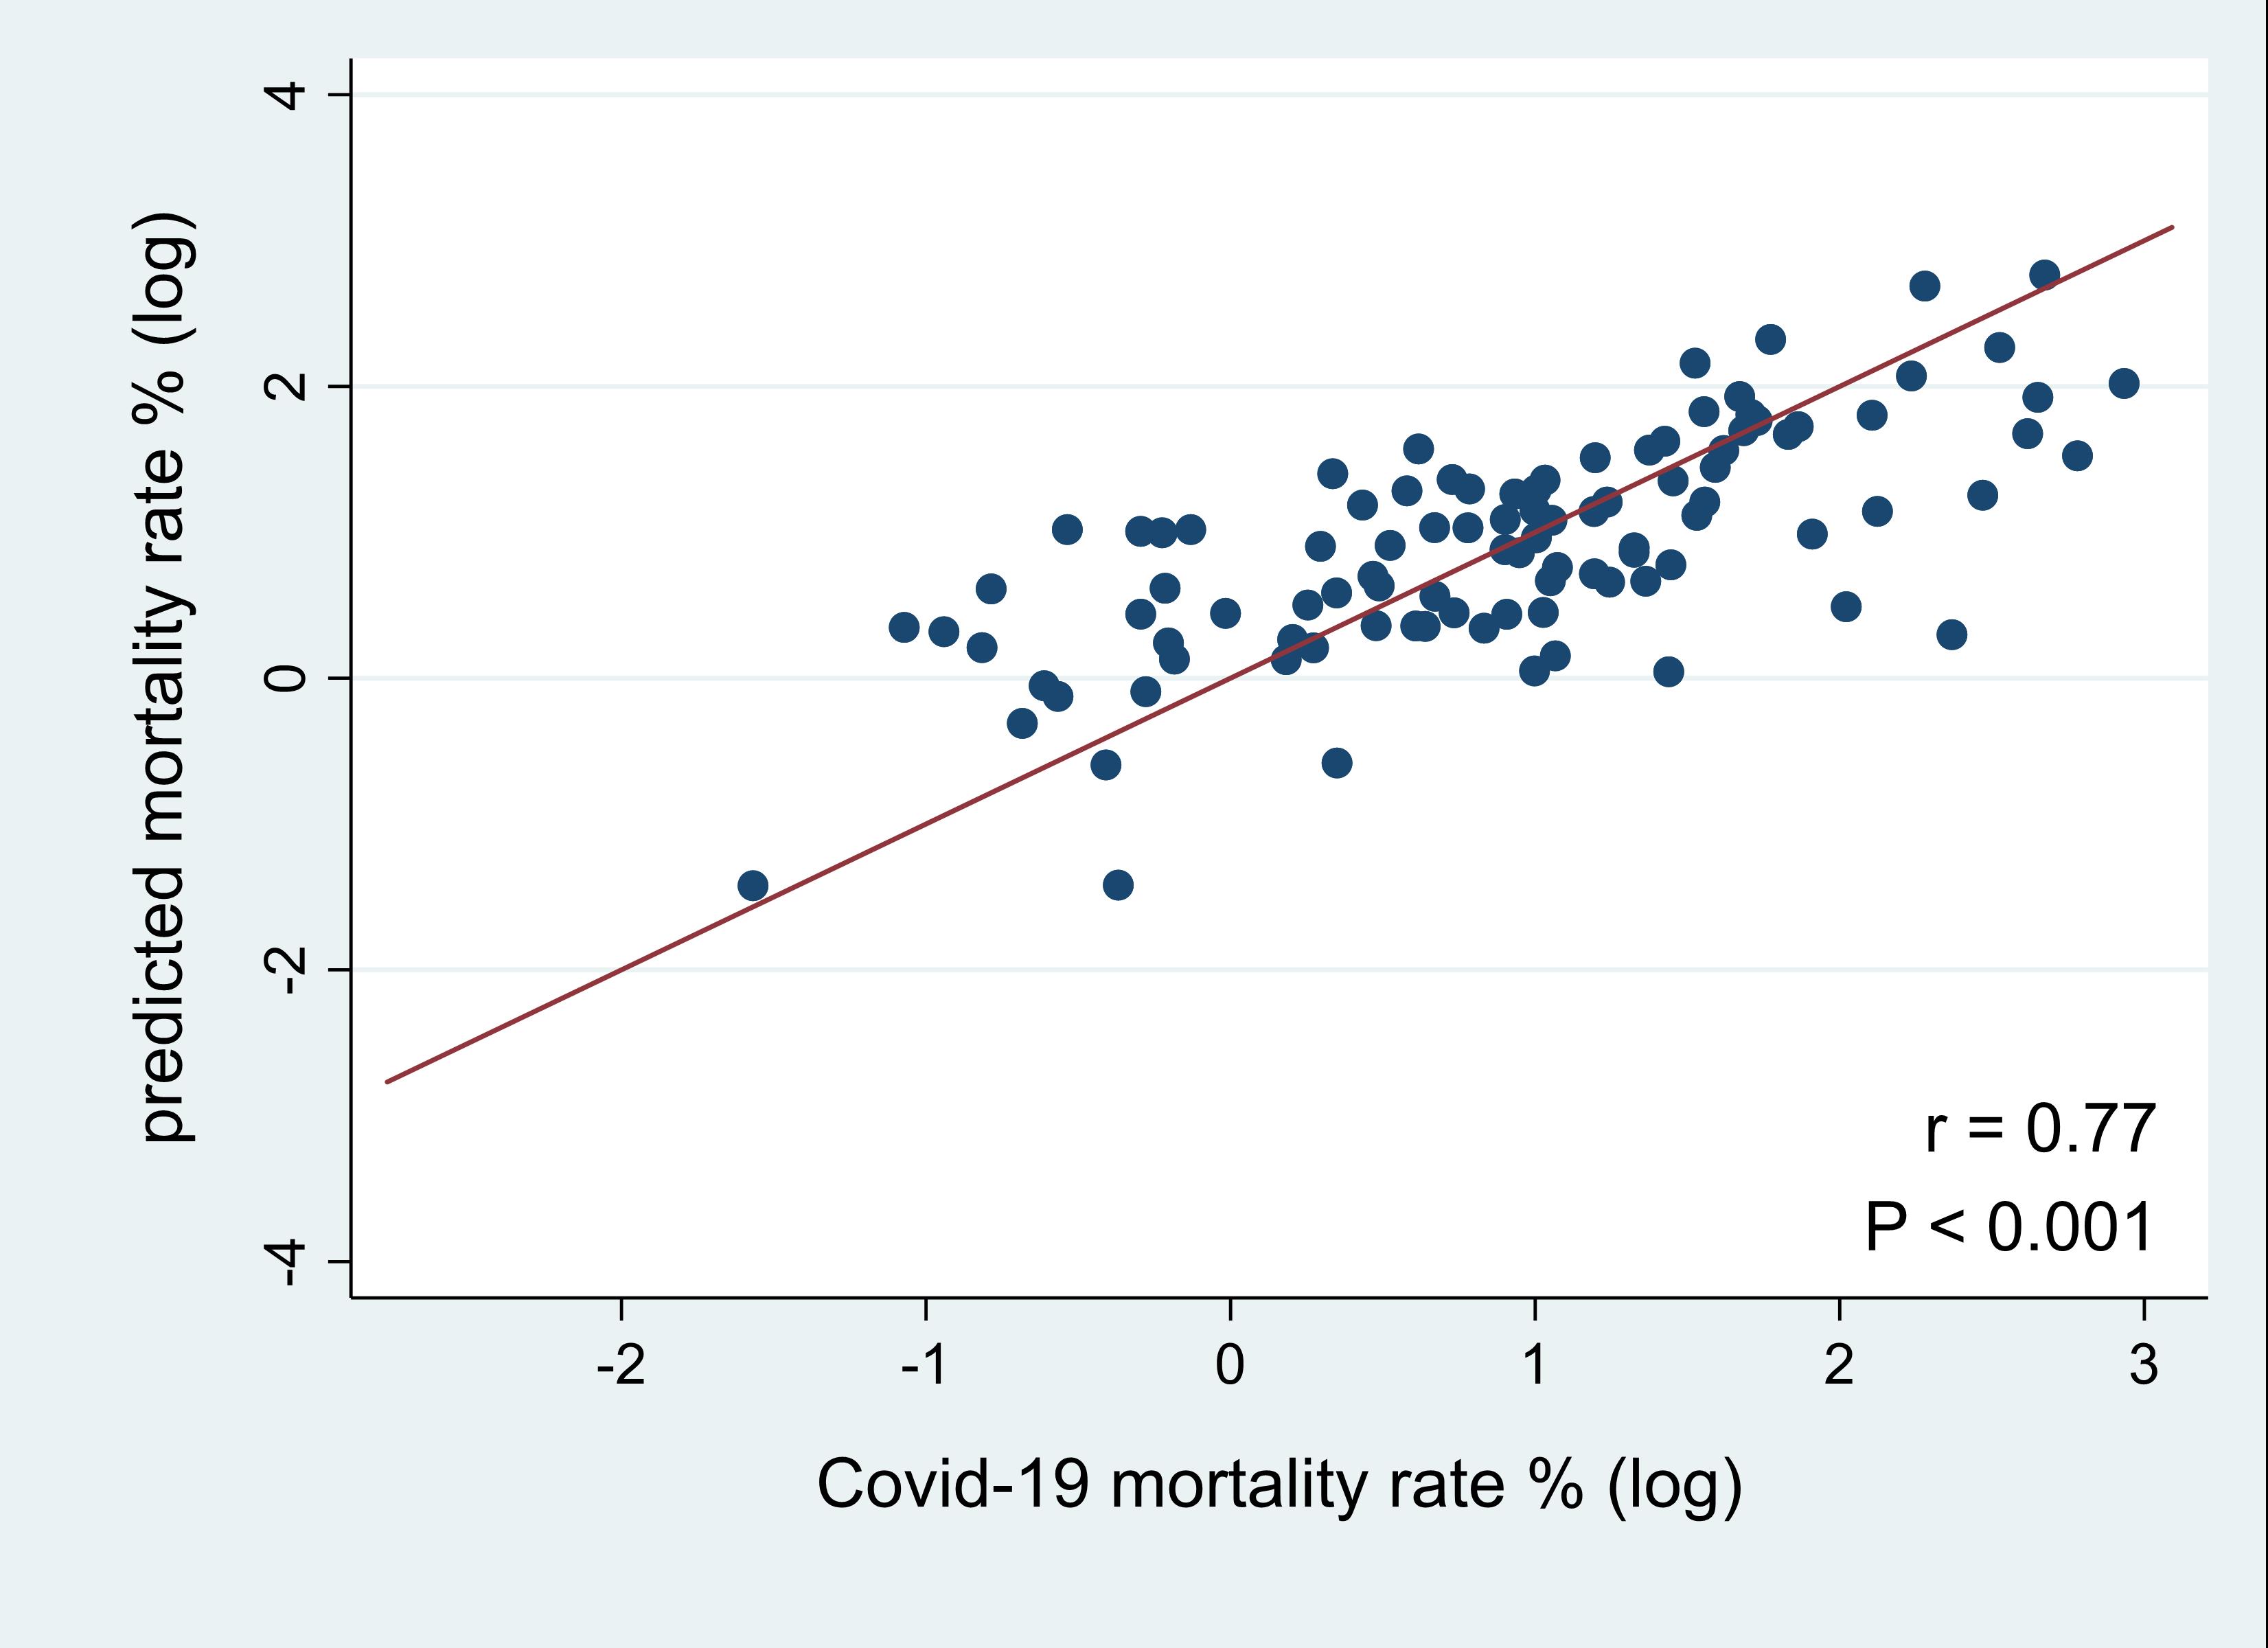
The multiple regression analysis shows that Covid-19 test numbers, the government effectiveness score, and the number of hospital beds were negatively associated with Covid-19 mortality rates. In addition, Covid-19 mortality rate was positively associated with proportion of population aged 65 or older and transport infrastructure quality. Overall, predicted mortality rates were highly associated with observed mortality rates (r = 0.77; P<0.001). Furthermore, the negative association between Covid-19 mortality and test number was stronger among low-income countries and countries with lower government effectiveness scores, younger populations and fewer hospital beds.
To conclude, increasing Covid-19 test numbers and improving government effectiveness have the potential to reduce Covid-19 mortality. The potential benefit of testing varied with country characteristics. The results of this study will contribute to pandemic-related policymaking at the country level, such as open public testing.

Correlation between observed and predicted Covid-19 mortality rates
More than 23 million people had been infected with Covid-19, and more than 800,000 worldwide had died, as of August 24, 2020. The most striking fact is that the Covid-19 mortality rate varies greatly across countries, from 28.6% in Yemen, 13.7% in Italy, to 0.2% in Qatar and 0.1% in Singapore. Such wide variation implies that there are factors other than patient characteristics that determine Covid-19 mortality. But what exactly are those factors?
Patient-level studies have shown that Covid-19 mortality can be explained by age, race, obesity, underlying diseases, clinical symptoms and previous immunity and virus mutations. These findings are instrumental for identifying high-risk patients. However, this evidence alone may not be sufficient to support effective policies for reducing Covid-19 mortality. In many political debates, scholars have emphasized the importance of health system capacity and health care resources to battle against the pandemic. Increasing Covid-19 testing has been advocated to attenuate its spread. However, the resulting evidence has not been used to explain country variations in Covid-19 mortality.
Our study explored factors associated with Covid-19 mortalities at the country level, where mortality is defined as the number of deaths per 100 Covid-19 cases. Countries differ in their testing policies and quality of governance; thus, we examined whether Covid-19 testing can reduce Covid-19 mortalities. Furthermore, we investigated whether government effectiveness, a key dimension of governance, is associated with Covid-19 mortality. Other factors examined in our research are proportions of aged persons, number of hospital beds, preexisting disease patterns and quality of transport infrastructure. To the best of the authors’ knowledge, this is the first country-level study to systematically examine factors related to Covid-19 mortality.
We assembled data on June 13 from 169 countries, covering a population of 7.5 billion and 7.8 million Covid-19 patients. Data were retrieved from three websites: “Worldometer: coronavirus,” Worldwide Governance Indicators (WGI), and World Development Indicators (WDI). WGI use surveys of households and firms, and expert assessments to calculate government effectiveness scores for over 200 countries. The scores ranged from -2.5 to 2.5, with a lower value indicating a lower level of effectiveness. The scores captured perceptions of a diverse group regarding the quality of public and civil services (e.g., education and basic health services), the quality of policy formulation and implementation, and the government commitment to such policies. WDI are compiled by the World Bank and provide comprehensive cross-country comparable data. Data for selected sample countries are summarized in Table 1.
Results from our regression analyses demonstrated that Covid-19 test number, government effectiveness score, and number of hospital beds were negatively associated with Covid-19 mortality rates. In addition, the Covid-19 mortality rate was positively associated with proportion of population aged 65 or older and transport infrastructure quality score. These findings indicate that countries with fewer hospital beds, older populations, and better transport infrastructure are likely to have higher Covid-19 mortality rates. Countries with higher test numbers and higher government effectiveness scores appeared to have lower Covid-19 mortalities. Overall, predicted mortality rates were highly associated with observed mortality rates (correlation coefficient = 0.77; P<0.001).
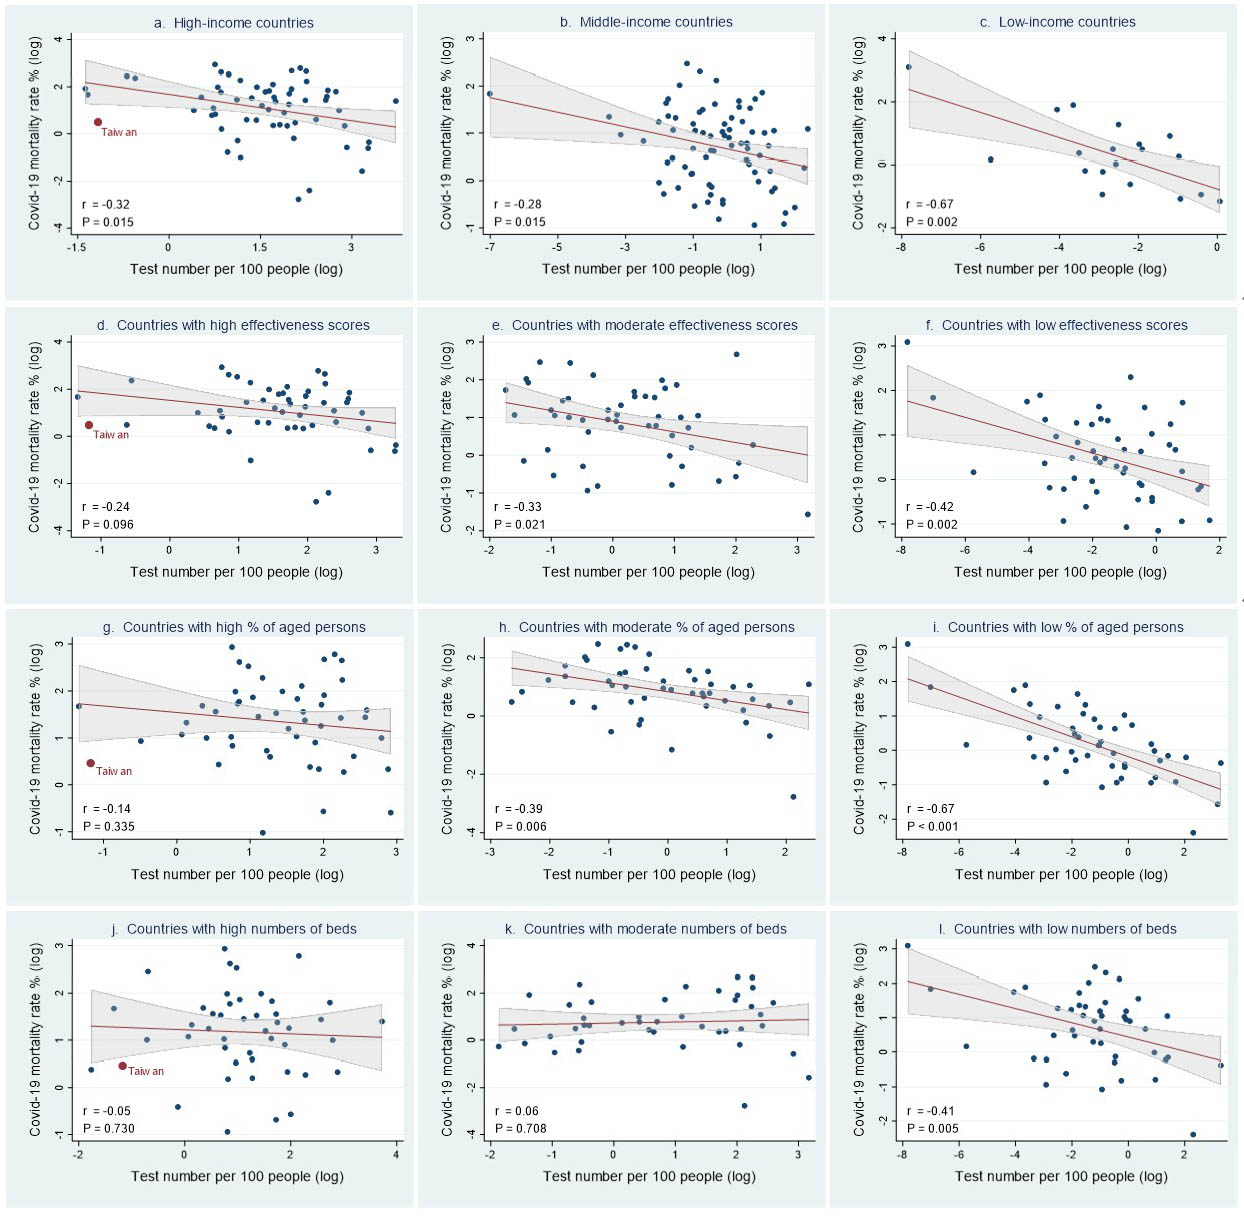
Interestingly, we further discovered that the relationship between test number and mortality was heterogeneous across country groups. The negative association between Covid-19 mortality and test number was stronger among low-income countries (Figure 1c) and countries with lower government effectiveness scores (Figure 1f), younger populations (Figure 1i) and fewer hospital beds (Figure 1l). Such negative associations were not statistically significant in countries with high government effectiveness (Figure 1d), high percentages of older populations (Figure 1g) and high or moderate numbers of hospital beds (Figure 1j, 1k). Taiwan is categorized as high-income, with high government effectiveness (top 14%), a high percentage of older population (top 23%), and a high number of beds (top 16%). Accordingly, increasing test numbers may have limited effects on reducing mortality in Taiwan.
Table 1 Covid-19 mortality rate, test number, government effectiveness score, proportions of aged persons, and number of hospital beds for selected countries
| COVID-19 mortality rate(%) |
Test number (per 100 population) |
Government effectiveness score | Population aged 65 or older (%) | Number of beds per 1,000 people | |
| France | 18.8 | 2.1 | 1.5 | 20.0 | 6.5 |
| Italy | 14.5 | 7.5 | 0.4 | 22.8 | 3.5 |
| United Kingdom | 14.2 | 9.5 | 1.3 | 18.4 | 2.8 |
| China | 5.6 | N/A | 0.5 | 10.9 | 3.8 |
| United States | 5.5 | 7.2 | 1.6 | 15.8 | 2.9 |
| Japan | 5.3 | 0.3 | 1.7 | 27.6 | 13.3 |
| Brazil | 5.0 | 0.7 | -0.4 | 8.9 | 2.2 |
| Germany | 4.7 | 5.6 | 1.6 | 21.5 | 8.3 |
| India | 2.9 | 0.4 | 0.3 | 6.2 | 0.7 |
| South Korea | 2.3 | 2.1 | 1.2 | 14.4 | 11.5 |
| South Africa | 2.2 | 1.8 | 0.3 | 5.3 | N/A |
| Taiwan | 1.6 | 0.3 | 1.4 | 14.1 | 5.7 |
| Russia | 1.3 | 9.7 | -0.1 | 14.7 | 8.2 |
| Singapore | 0.1 | 8.4 | 2.2 | 11.5 | 2.4 |
Note: Covid-19 mortaliy rate and test numbers are for June, 13, 2020. Data on government effectiveness scores and popualtion aged 65 or older are for year 2018. Data on bed numbers are for year 2015. N/A means no data at the time this research was conducted.

Figure 1 Correlation between Covid-19 mortality rate and test number. Countries were categorized by income group (a – c): a. High-income (N=59), b. Middle-income (N=75), c. Low-income (N=19); by government effectiveness scores (d – f): d. High effectiveness scores (N=50), e. Moderate effectiveness scores (N=50), f. Low effectiveness scores (N=51); by percentage of people aged 65 or older (g – i): g. High percentages of aged persons (N=49), h. Moderate percentages of aged persons (N=49), i. Low percentages of aged persons (N=49); by number of hospital beds (j – l): j. High numbers of beds (N=45), k. Moderate numbers of beds (N=43), l. Low numbers of beds (N=46). Lines are linear predictions of Covid-19 mortality rate on test number. The 95% confidence intervals of the fitted values are shown by the grey areas (r: correlation coefficient).
STAY CONNECTED. SUBSCRIBE TO OUR NEWSLETTER.
Add your information below to receive daily updates.


