
Viewing South China Sea’s Seafloor Topography from Space

Author(s)
Tang-Huang LinBiography
Professor Lin has been a Professor at the National Central University (NCU) since 2018. His research interests focus on the monitoring of environmental and climate changes via satellite observations, and the impacts of analysis, including aerosol remote sensing and partitioning, the effects of ambient PM2.5 exposure on public health, and urbanization effects on heat islands.
Academy/University/Organization
National Central UniversitySource
exhibitionhttps://www.futuretech.org.tw/futuretech/index.php?action=brands_detail&br_uid=128# -
TAGS
-
Share this article
You are free to share this article under the Attribution 4.0 International license
- ENGINEERING & TECHNOLOGIES
- Text & Image
- January 02,2022
The vertical distribution of aerosols is significant for accurate surface PM2.5 retrieval and the initial modeling forecasts of air pollution, while the observation of aerosol profiles on the regional scale is seriously limited. An approach to aerosol extinction profile fitting was thus proposed to improve surface PM2.5 from satellite observations. With the high similarity of the distribution pattern, the log-normal distribution is explored for the single-peak fitting model based on a decadal dataset (3248 in total) from Micro Pulse LiDAR measurements. Considering the seasonal impacts on the planetary boundary layer height (PBLH), Mode, and the height of the surface layer, the extinction profile is then constructed in terms of PBLH and the total column aerosol optical depth (AOD). The well consistency between constructed 3D aerosol extinction and surface PM2.5 indicates the high performance of satellite observations for providing accurate PM2.5 data on the regional and/or global scales.
Air pollution/atmospheric aerosols is one of the top issues related to public health, global warming, and climate change; observation/monitoring is thus very important. Due to the obvious characteristics of spatial and temporal distributions with mixed components, the observations are greatly limited. Taking the advantages of satellite observation, the proposed technology focuses on developing the advanced remote sensing technologies in providing more complete observations of atmospheric aerosol properties and PM2.5. In terms of the achievements in aerosol profile fitting and type partitioning approaches, the issues related to PM2.5 near-real time monitoring, aerosol/PM2.5 3D distribution, and the initial input of 3D aerosols for multiscale air quality modeling systems (CMAQ or WRF chem) can be potentially dealt with.
Concerning the uncertainty of assuming well-mixed aerosols within the planetary boundary layer, a sensible aerosol vertical distribution described by a log-normal fitting function is proposed to provide more realistic single-peak extinction profiles with a decadal MPL in situ dataset as Figure 1 illustrates. The performance of fitted single-peak aerosol profiles can reach a correlation coefficient of up to 0.8973 when considering the seasonal variations in PBLH and the surface layer height of well-mixed aerosols. Eventually, not only the aerosol extinction profile but also the 3-dimensional distribution are promising to be created from satellite AOD retrieval with PBLH information for providing accurate PM2.5 monitoring on a regional scale.
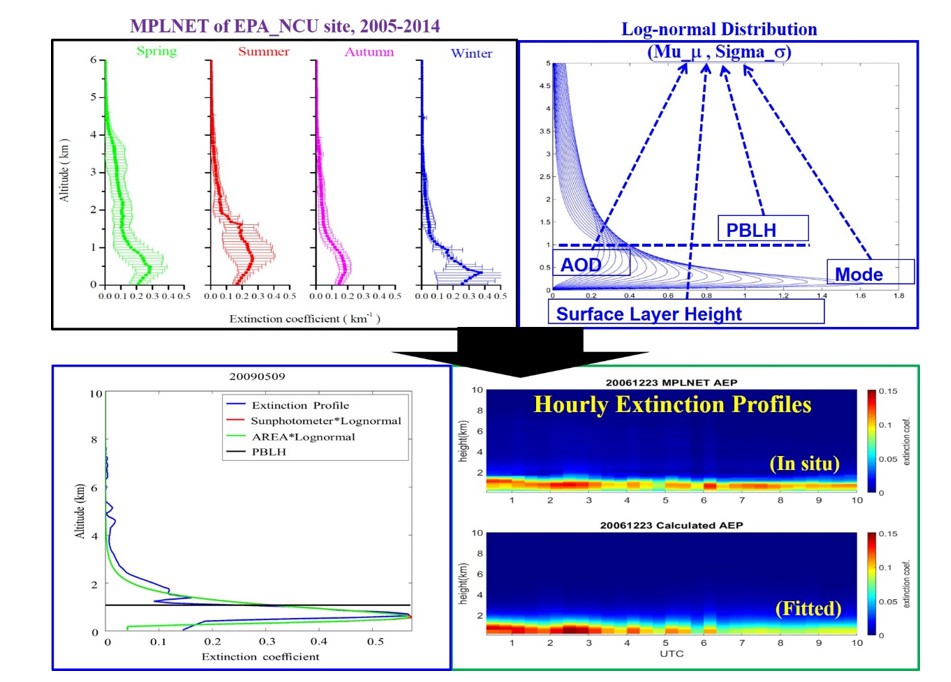
Figure 1. The schematic concept of the fitting approach for single-peak aerosol extinction profiles based on in situ measurements: (a) the seasonal profiles of aerosol extinction at the MPLNET NCU_Taiwan site from 2005 to 2014; (b) the log-normal distributions with different logarithmic standard deviations after being rotated 90 degrees clockwise; (c) the aerosol extinction profile observed from the Micro Pulse LiDAR network (MPLNET) NCU_Taiwan site on May 9, 2009 (blue line) and manual fitting with a log-normal distribution (green line). The red line shows the sun photometer aerosol optical depth (AOD) integrated profile, whereas the black line indicates the planetary boundary layer height (PBLH); (d) comparisons of the fitted extinction profiles with the measurements of the MPLNET NCU_Taiwan site every 20 minutes during the daytime on 2006/12/23.
In terms of the planetary boundary layer height (PBLH) and the total column aerosol optical depth (AOD), the single-peak aerosol profiles can be well described by the proposed log-normal distribution model with the following breakthroughs:
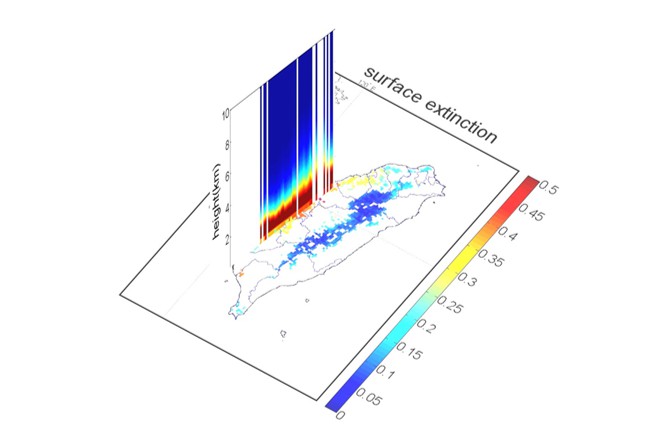
- New satellite retrievals in aerosol extinction profile (Figure 2c);
- Enabling satellite observation to provide 3D aerosol distribution (from columnar 2D);
- Improving satellite remote sensing of surface PM2.5 (Figure 2f) with high temporal observation every 20 minutes;
- Overcoming the international limitation in constructing 3D PM2.5 initial input for modeling air pollution forecasting.
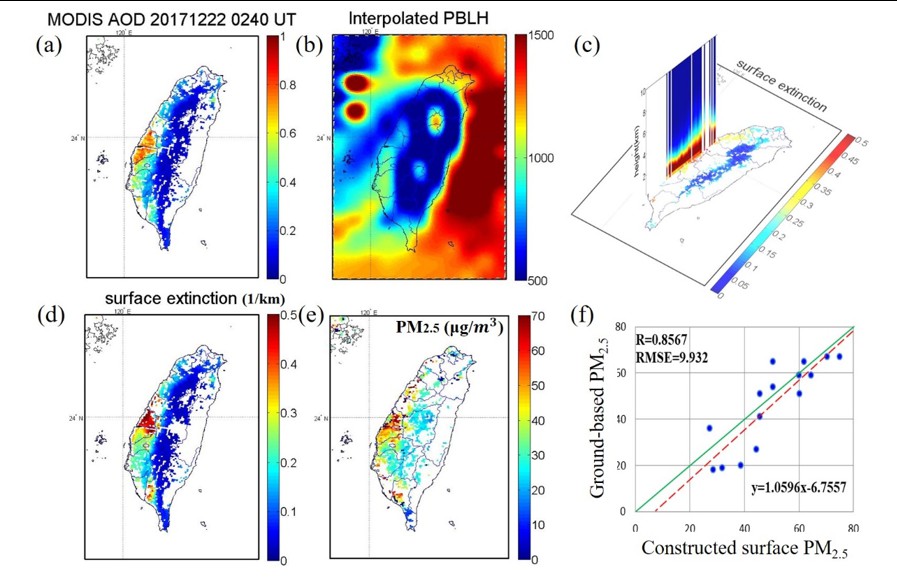
Figure 2. The application of the proposed log-normal fitting method to the dataset on October 29, 2014, at 10:30 local time (LT). (a) Spatial distributions of the acquired MODIS AOD. (b) Spatial distributions of the acquired GEOS-5 FP PBLH products. (c) Distribution map of extinction coefficients below 500 m. (d) The fitted 3D extinction coefficients over Taiwan; (e) the distribution of ground-based PM2.5; and (f) scatter plots of extinction coefficients within the surface layer from MODIS AOD with ground-based PM2.5. R is the correlation coefficient.
The proposed model for single-peak aerosol profile fitting will facilitate the advantages for industrial application as follows:
- Associated with multiple satellite observations, the unique 3D aerosol distribution highly increases industrial competitive capability internationally;
- It is very practical with high performance and low operational cost;
- The near real-time air pollution monitoring is enabled on a large scale which is well qualified for the public health issues;
- Associated with the fitting extinction profile, it can potentially contribute to providing 3D aerosol initial input for modeling forecasts of air pollution as Figure 3 indicates.
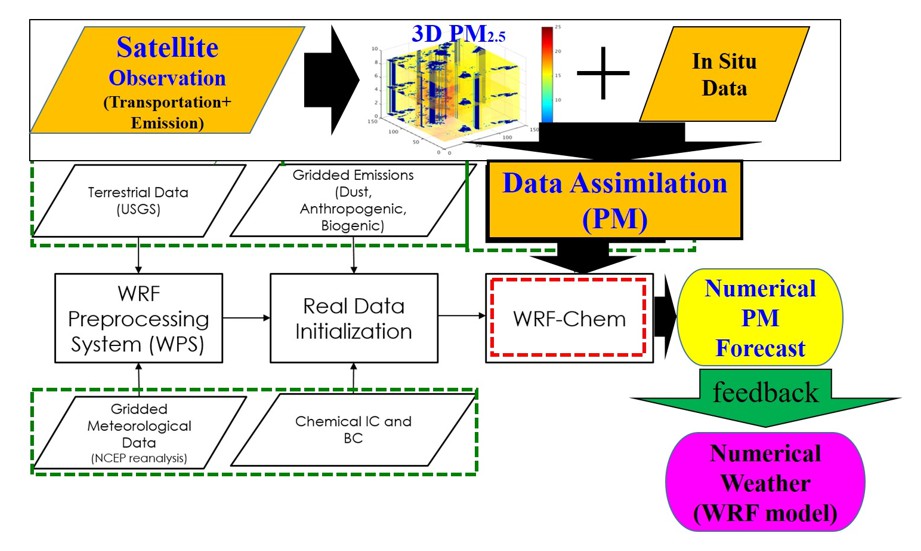
Figure 3. The scheme of 3D aerosol initial input for modeling PM2.5 forecasting and feedback of the numerical weather model.
RELATED


STAY CONNECTED. SUBSCRIBE TO OUR NEWSLETTER.
Add your information below to receive daily updates.