

Windowed Fourier Transform Biosensing through Fano Resonance to Enhance Sensitivity
Author(s)
Fuan TsaiBiography
Fuan Tsai is a professor and Director of the Center for Space and Remote Sensing Research, National Central University. His areas of research interest include remote sensing, spatial analysis, and digital city modeling and applications. He also teaches several undergraduate and graduate courses.
Academy/University/Organization
National Central UniversitySource
Lai, J-S, S-H Chiang and F. Tsai*, 2019a. "Exploring Influence of Sampling Strategies on Event-based Landslide Susceptibility Modeling", ISPRS International Journal of Geo-Information, 8:9, 397, 23 pp. doi:10.3390/ijgi8090397. Lai, J-S and F. Tsai*, 2019b. "Improving GIS-Based Landslide Susceptibility Assessments with Multi-temporal Remote Sensing and Machine Learning", Sensors, 19:17, 3717, 25 pp. doi:10.3390/s19173717.
Tsai*, F., J-S Lai, W. W. Chen and T-H Lin, 2013. Analysis of Topographic and Vegetative Factors with Data Mining for Landslide Verification”, Ecological Engineering, vol. 61-C, pp. 669-677.
Tsai*, F., J-H Hwang, L-C Chen and T-H Lin, 2010, "Post-Disaster Assessment of Landslides in Southern Taiwan after 2009 Typhoon Morakot Using Remote Sensing and Spatial Analysis", Natural Hazards and Earth System Sciences, 10(10), pp. 2179-2190.-
TAGS
-
Share this article
You are free to share this article under the Attribution 4.0 International license
- ENGINEERING & TECHNOLOGIES
- Text & Image
- October 21,2020
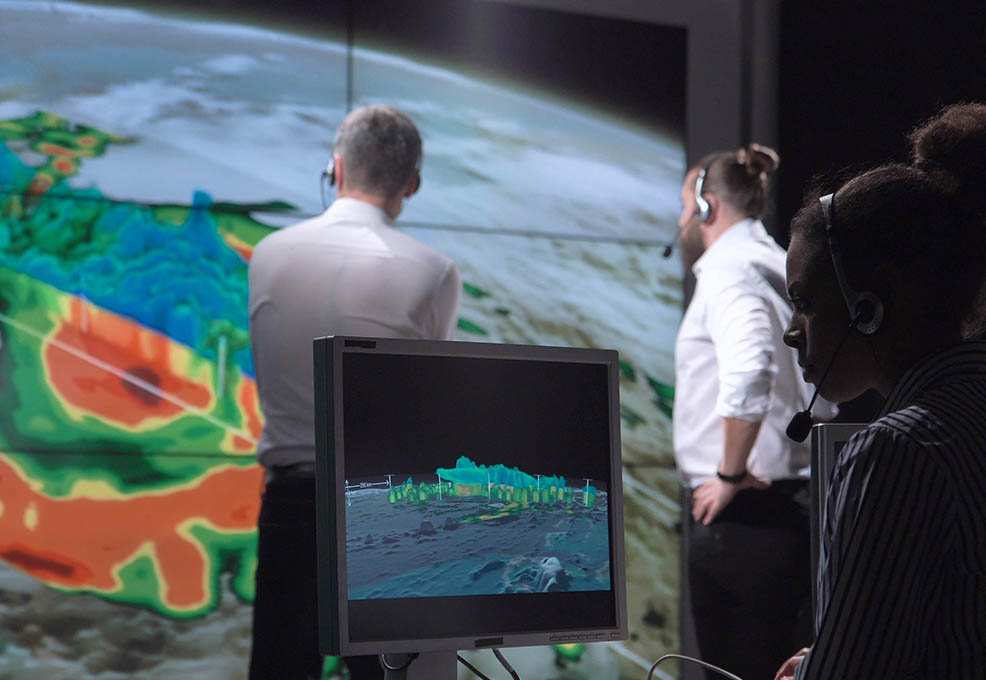
Remote sensing is effective and efficient for collecting data over a large area and recurrently. In particular, versatile remote sensing sensors and platforms are capable of providing more comprehensive and detailed information for hazard investigation, monitoring and mitigation. The Center for Space and Remote Sensing Research (CSRSR) of National Central University (NCU) is the leading institute in the research and development of state-of-the-art remote sensing and spatial information science. CSRS has been applying remote sensing and spatial analysis to the monitoring and analysis of disasters and hazards caused by natural and man-made events, such as earthquakes, typhoons, flooding, landslides, etc., worldwide in order to provide the authorities with timely and important information for hazard management and mitigation. In addition, similar techniques and operations are also used in the long-term deformation monitoring of land-important infrastructure.
Remote sensing is a sophisticated technology that can obtain critical data and information over a large area and recurrently. In particular, remote sensing can be used to investigate, monitor and analyze different natural and man-made hazards, such as earthquakes, flooding, landslides, etc., when on-site investigation is often difficult, expensive and inconvenient. Remote sensing can provide more comprehensive and detailed information to support sophisticated hazard management and mitigation operations. The Center for Space and Remote Sensing Research (CSRSR) of National Central University is the leading institute in the research and development and applications of remote sensing and spatial information sciences. The Resource Satellite Receiving Station in CSRSR can directly receive and process multi-source remote sensing imagery; it also provides advanced valued-added products and services for different applications.
CSRSR has been actively and successfully utilizing versatile remote sensing to investigate and monitor different disasters and hazards worldwide, and has published the analysis results on their “Disaster Information Platform.” (CSRSR is also a “Data Analysis Node” of the Sentinel Asia initiative.) For example, in 2009, Typhoon Morakot induced large-scale landslides and caused a catastrophic annihilation of a mountain village (Xiaolin) in Southern Taiwan. In this tragic event, remote sensing and spatial analysis provided timely information about the disaster and various characteristics of the landslides (Tsai et al., 2010). In addition, integrated with other spatial data and combined with spatial data mining, the analysis can further produce the susceptibility of landslides similar to the one displayed in Fig. 1. To support hazard mitigation planning (Tsai et al., 2013), recently, these types of algorithms have been fortified with machine learning for advanced spatial analysis in hazard mitigation applications (Lai et al., 2019a; Lai et al., 2019b).
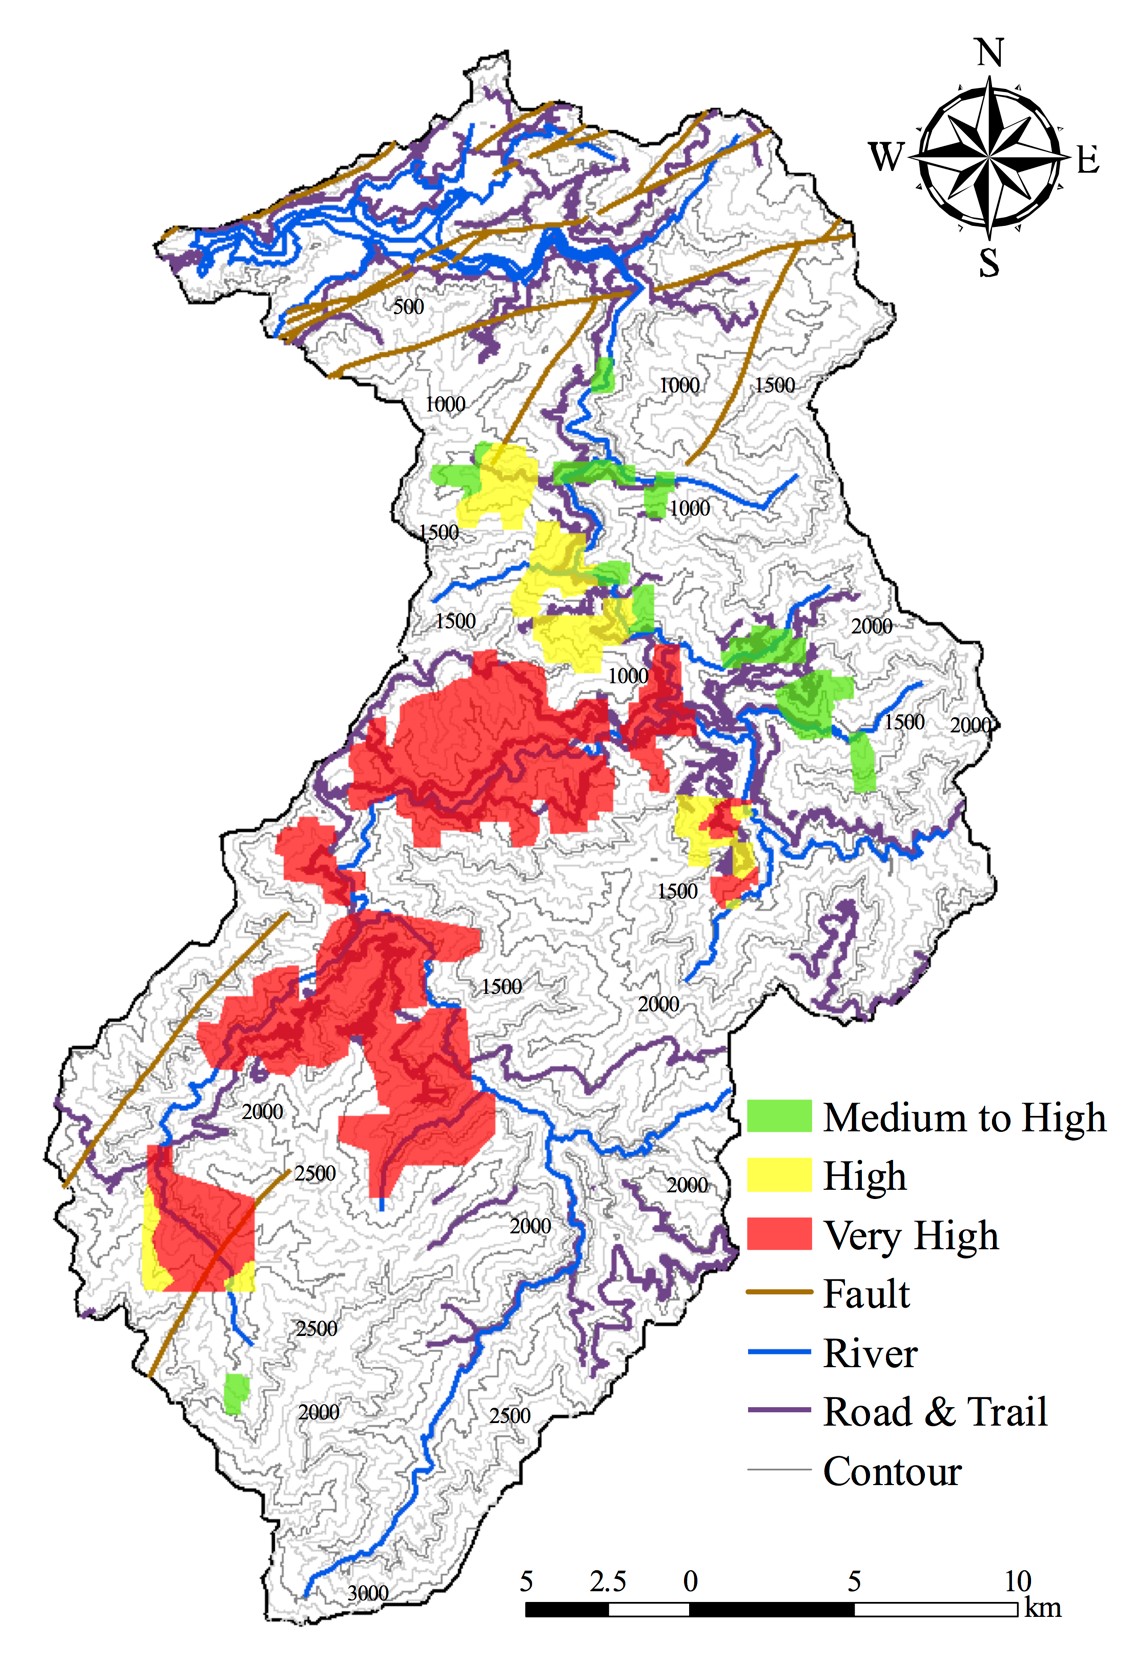
Fig. 1: Landslide susceptibility map of Shimen Watershed produced from remote sensing and spatial analysis.
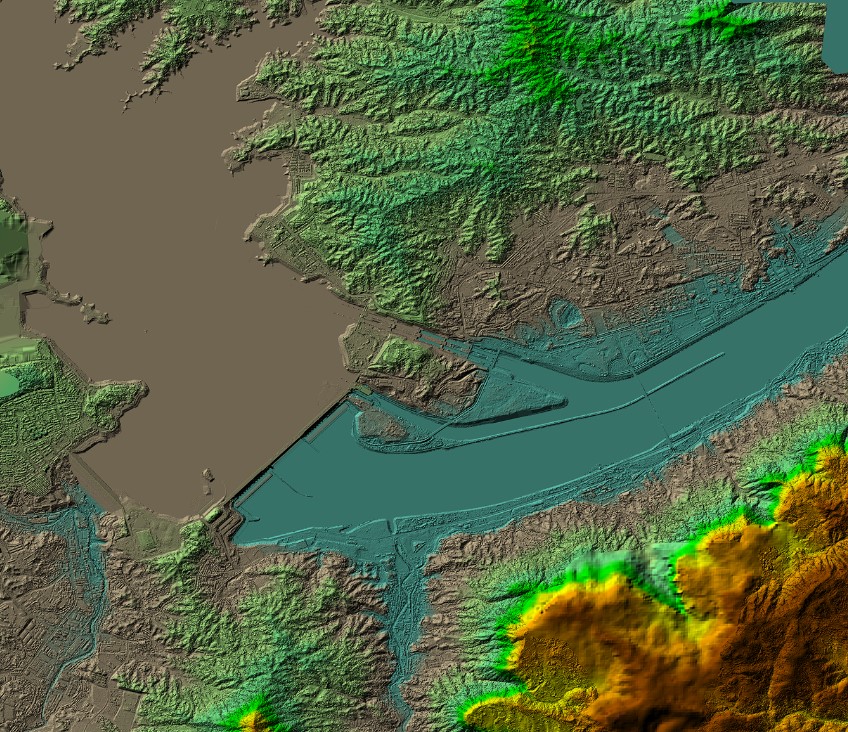
Fig. 2 is another example of utilizing remote sensing to monitor large-scale natural hazards. The figure demonstrates the use of multiple satellite remote sensing data to monitor the flooding of the Yangtze River in China. The upper right subfigure is a SPOT satellite image showing a town and its vicinity in Jiangxi before the flooding, while the lower-right displays the inundation of the same area. The left of the figure displays two Synthetic Aperture Radar (SAR) images of different bands and resolution, and both images clearly exhibit the flooded areas (shown as black in the image). As demonstrated in this example, the integration of multi-source remote sensing data analysis can provide an accurate assessment of the hazard as well as the detailed land-cover information of the area. Researchers in CSRSR further utilized more advanced remote sensing analysis algorithms to derive implicit characteristics of particular areas or targets. Fig. 3 shows the three-dimensional (3D) Digital Surface Model (DSM) of the Three-Gorge Dam area and the textured 3D model of the dam. The 3D model was constructed from a pair of very high resolution Pleiades satellite images using stereo photogrammetry algorithms.
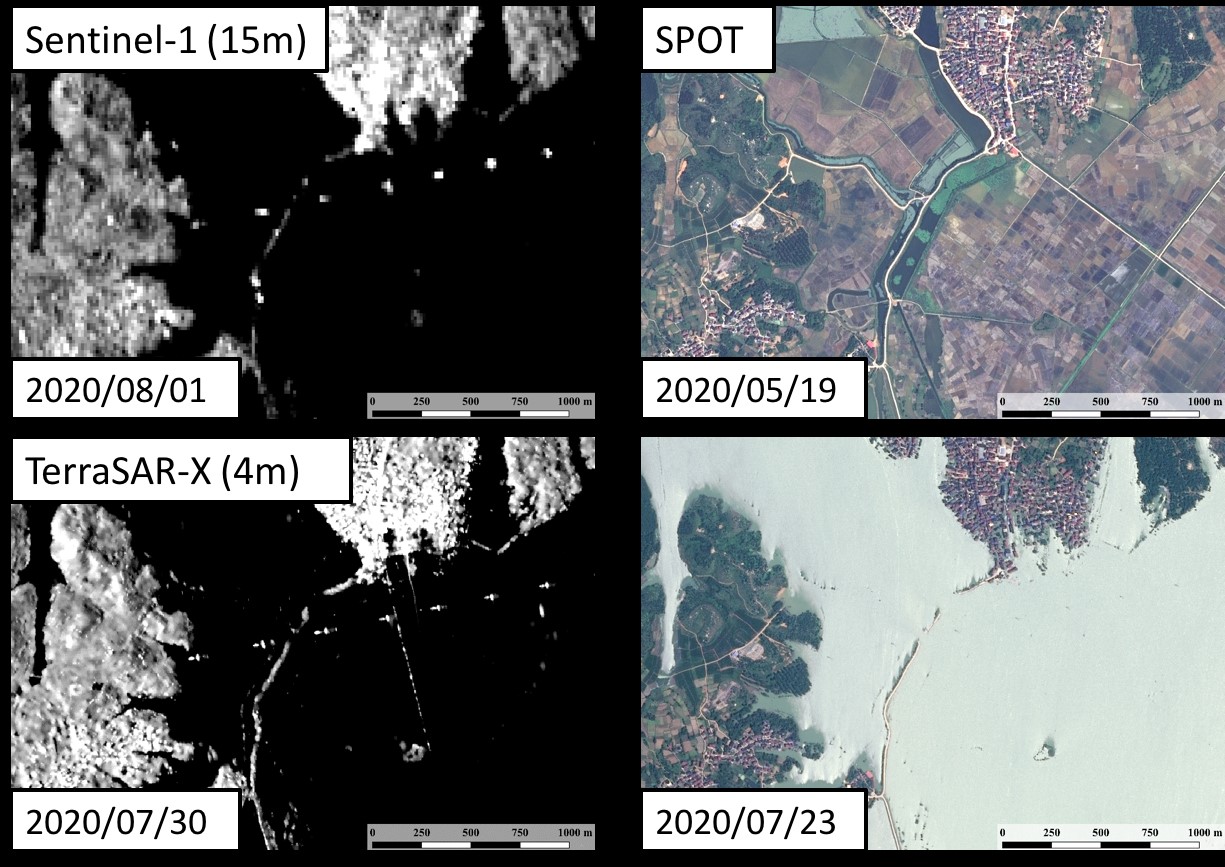
Fig. 2: Disaster monitoring example of the Yangtze River flooding.
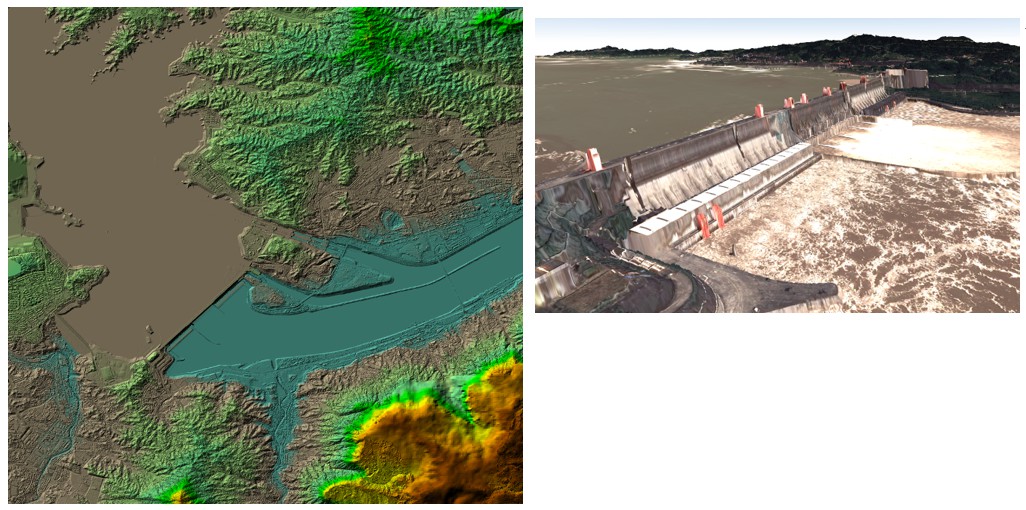
Fig. 3: Three-dimensional DSM of the Three-Gorges Dam area (left) and the textured 3D model of the dam (right) generated with stereo satellite remote sensing.
Using multi-temporal SAR data and Differential Interferometric SAR (DInSAR), we can detect imperceptible deformation of the land. Fig. 4 shows the DInSAR analysis result and the deduced Line of Sight (LOS) land deformation of two SAR images acquired before and after the Hualien earthquake in Feb., 2018, in which the land deformation (subsidence and uplift) are clearly identified. A similar InSAR technique was also extended (Persistent Scatterer InSAR, PSInSAR) to analyze dozens of SAR images collected over years for long-term land deformation monitoring, as displayed in Fig. 5. PSInSAR analyses of high resolution SAR data are also carried out to monitor selected important infrastructures, such as bridges, high-speed rails, dams, etc.
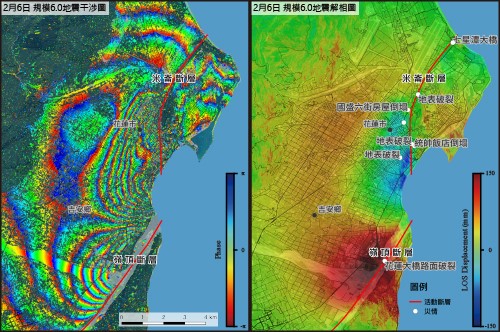
Fig. 4 DInSAR analysis for land deformation estimation after 2018 Hualien Earthquake.
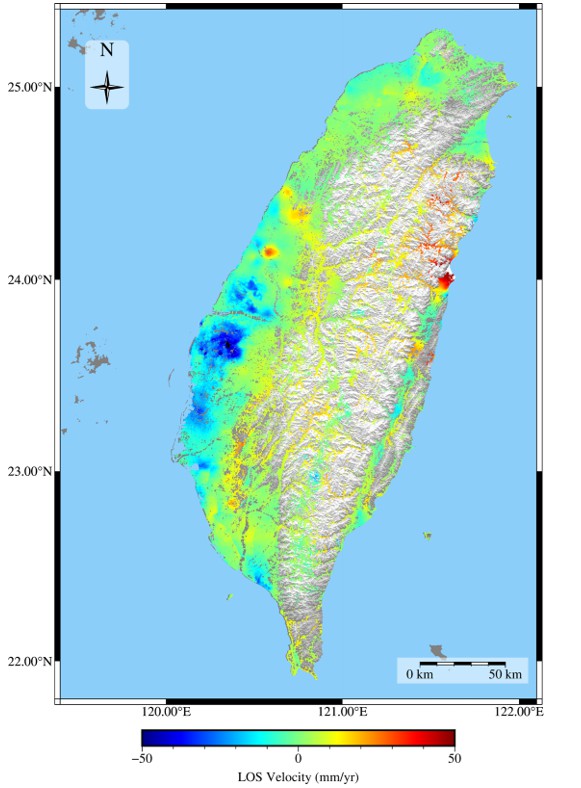
Fig. 5: PSInSAR analysis result of the whole of Taiwan between 2016 and 2019.
RELATED

STAY CONNECTED. SUBSCRIBE TO OUR NEWSLETTER.
Add your information below to receive daily updates.