

Mud-diapirism-induced Lateral Extrusion in the SW Taiwan Mountain Belt

Author(s)
Jia-Yuh YuBiography
Dr. Yu is a professor of Atmospheric Sciences at National Central University (NCU). He is currently also the committee chair of the Atmospheric Sciences Division under the Ministry of Science and Technology (MOST). His research interests cover a wide range of climate science, from fundamental climate dynamic theory, atmospheric low-frequency variability to typhoon-climate interaction.
Academy/University/Organization
National Central UniversityEdited by
Jia-Yuh Yu, Chao-An Chen, Hien Xuan Bui, and Hsiao-Wei LiuSource
Chao-An Chen, Jia-Yuh Yu, and Chia Chou, 2016: Impacts of vertical structure of convection in global warming: The role of shallow convection. J. Climate, 29, 4665-4684.https://doi.org/10.1175/JCLI-D-15-0563.1
Hsiao-Wei Liu, Jia-Yuh Yu, and Chao-An Chen, 2018: Changes of tropical precipitation and convective structure under global warming projected by CMIP5 model simulations. Terr. Atmos. and Ocean. Sci., 29, 429-440.https://doi.org/10.1175/JCLI-D-15-0563.1
Hien Xuan Bui, Jia-Yuh Yu, Hsiao-Wei Liu, Chia-Yin Tu, Ping-Gin Chiu, and Huang-Hsiung Hsu, 2019: Convective structure changes over the equatorial Pacific with highly increased precipitation under global warming simulated in the HiRAM. SOLA, (accepted with minor revision).-
TAGS
-
Share this article
You are free to share this article under the Attribution 4.0 International license
- NATURAL SCIENCES
- Text & Image
- April 18,2019
Although the water vapor increases rather homogeneously under global warming, changes in precipitation and convective structure show a strong spatial variation with the coexistence of positive and negative precipitation anomalies as well as the enhancement of deep and shallow convections. The enhanced deep convection indicates a more stable atmosphere and a weakening of atmospheric circulation, while the enhanced shallow convection demonstrates a less stable atmosphere and a strengthened atmospheric circulation.
Although the water vapor increases homogeneously under global warming (Fig. 1a), changes in precipitation show a strong spatial variation with coexistence of positive and negative anomalies within and outside the Intertropical Convergence Zones (ITCZs) (Fig. 1b). The vertical velocity over the mid-troposphere illustrates opposite signs of changes with both strengthening (gray shaded) and weakening (orange shaded) of upward motion even within convective areas with positive rainfall anomalies (Fig. 1c). In other words, changes in precipitation are not always consistent with the changes in atmospheric vertical velocity. The latter exhibits a more complicated spatial distribution than the former, showing discrepancies in precipitation and convective structure changes (Fig. 1c).
![Figure1: Global-warming-induced changes in (a) column-integrated water vapor (mm), (b) precipitation (mm/day), and (c) vertical velocity (Pa/s) at 500 hPa over climatologically convective zones with positive precipitation anomalies. The results in December shown here are utilized as an example. These changes are from the MPI-ESM-LR model and were calculated by subtracting the 2080–99 climatology in the RCP8.5 scenario from the 1986–2005 climatology. The red lines in (b) and (c) represent the contours, which denote the boundary of ITCZs during the period 1986–2005. [adopted from Fig. 1 of Chen et al. (2016)]](/images/Global-warming-induced%20changes%20in%20(a)%20column-integrated%20water%20vapor%20(mm).png)
Figure1: Global-warming-induced changes in (a) column-integrated water vapor (mm), (b) precipitation (mm/day), and (c) vertical velocity (Pa/s) at 500 hPa over climatologically convective zones with positive precipitation anomalies. The results in December shown here are utilized as an example. These changes are from the MPI-ESM-LR model and were calculated by subtracting the 2080–99 climatology in the RCP8.5 scenario from the 1986–2005 climatology. The red lines in (b) and (c) represent the contours, which denote the boundary of ITCZs during the period 1986–2005. [adopted from Fig. 1 of Chen et al. (2016)]
To explore the mechanisms responsible for the above discrepancies under global warming, a budget analysis of the moisture equation was conducted. In the mean ascending region with a positive precipitation anomaly, this anomaly (see Fig. 2a) comes mainly from the strengthening of convection (-(ω'∂pq)>0), which is referred to as the dynamic effect, followed by a minor contribution from the enhancement of moisture stratification (-(ω∂pq')>0), which is referred to as the thermodynamic effect. In the mean ascending region with negative precipitation anomaly, the negative precipitation anomaly (see Fig. 2b) again comes from the dynamic effect (-(ω'∂pq)<0), which implies a weakening of convection. In contrast to Fig. 2a, the thermodynamic effect (-(ω∂pq')>0) here acts to partially offset the precipitation anomaly. In the mean descending region with positive precipitation anomaly, the anomaly (see Fig. 2c) is due to the strengthening of convection (-(ω'∂pq)>0), with intensity partially offset by the thermodynamic effect (-(ω∂pq')>0) because of positive(ω) . In the mean descending region with negative precipitation anomaly, the anomaly (see Fig. 2d) is mostly associated with the weakening of convection (-(ω'∂pq)>0), with additional support from the thermodynamic effect (-(ω∂pq')>0). Contributions from evaporation anomalies (E') and horizontal moisture advection anomaly (-(v‧▽q)' ) are all small.
%20mean%20ascending%20region%20with%20positive%20precipitation%20anomaly.png)
Figure2: Term budget results for the precipitation anomalies in (a) mean ascending region with positive precipitation anomaly (ω500 <0;p'>0), (b) mean ascending region with negative precipitation anomaly (ω500 <0;p'<0), (c) mean descending region with positive precipitation anomaly (ω500 >0;p'>0), and (d) mean descending region with negative precipitation anomaly (ω500 >0;p'<0). All terms are in energy units (W m-2). The fractional area coverage (in %) for each sub-domain from (a) - (d) is 26.9, 13.8, 21.4, and 37.8%, respectively.
Figures 3a and 3c show the longitude-height cross sections of the mean “apparent heat source” Q1 and “apparent moisture sink” Q2 along the equator. To the west of the dateline (within ITCZ), large amplitudes of Q1 and Q2 indicate the dominance of deep convection. To the east of the dateline (outside ITCZ), Q1 and Q2 are mostly negative throughout the troposphere, which shows the dominance of subsidence motions. Under global warming, positive Q1 and Q2 anomalies occur in the upper troposphere west of 170°W, indicating the enhancement of deep convection. In contrast, positive Q1 and Q2 anomalies are confined to the lower troposphere east of 170°W, implying the enhancement of shallow convection (Figures 3b and 3d). The enhanced deep convection indicates a more stable atmosphere and a weakening of atmospheric circulation, while the enhanced shallow convection demonstrates a less stable atmosphere and a strengthened atmospheric circulation.
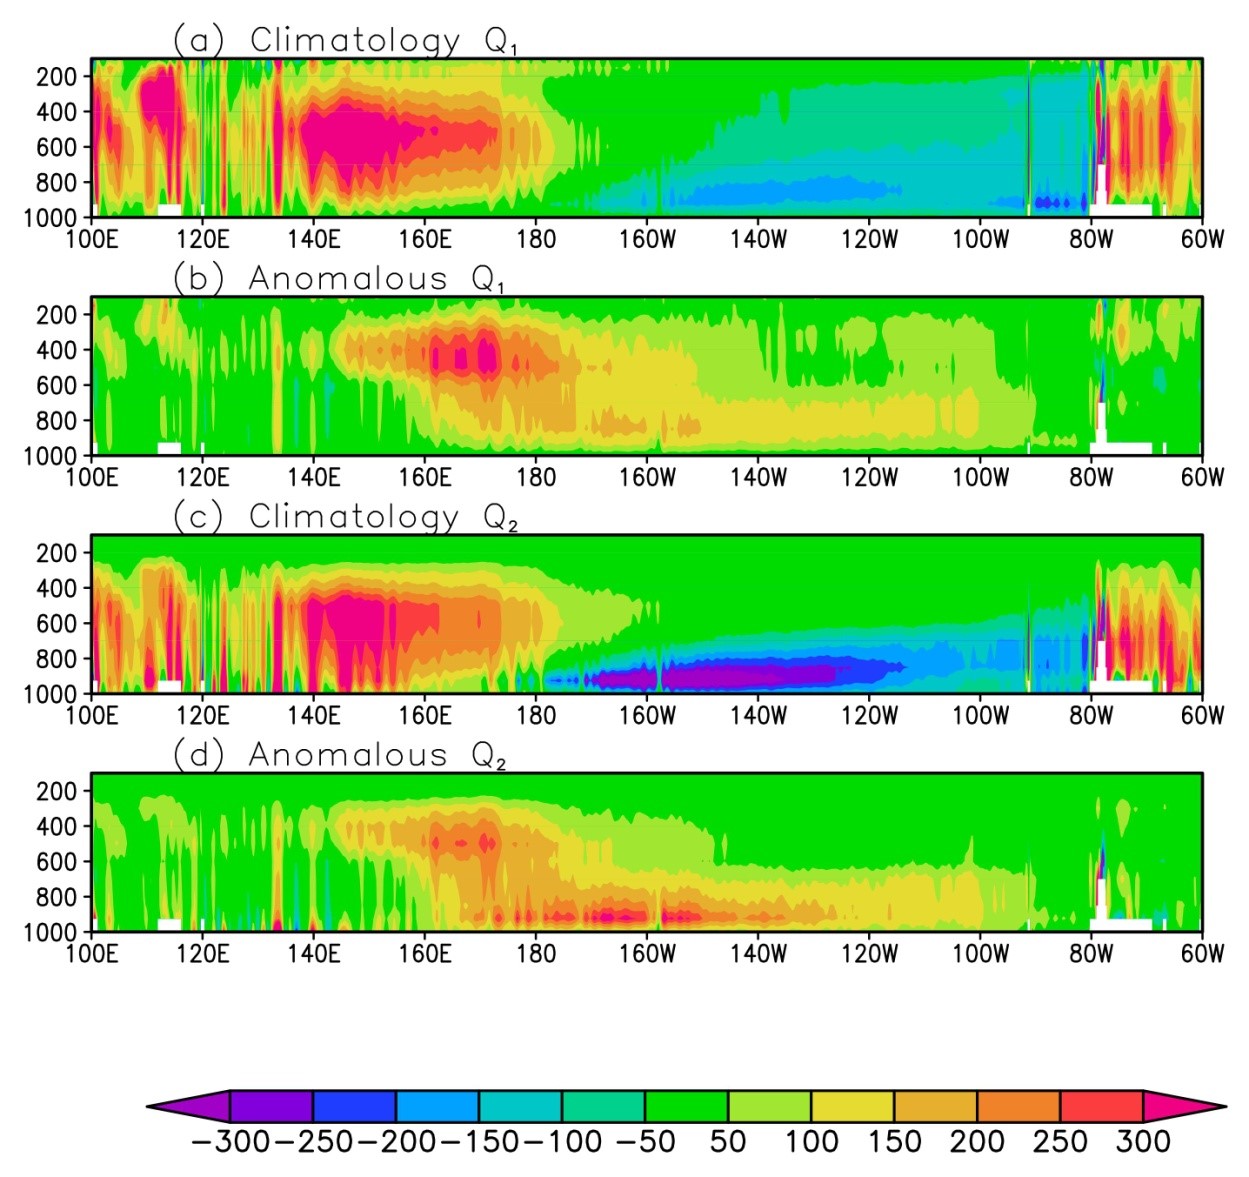
Figure3: Longitude-height cross sections along the equator of the (a, b) apparent heat source Q1 and and (c, d) apparent moisture sink Q2 for the climatological mean and difference between the late 21st Century and the present-day simulations. Units are W kg−2. [Adopted from Fig. 3 of Bui et al. (2019)]
RELATED


STAY CONNECTED. SUBSCRIBE TO OUR NEWSLETTER.
Add your information below to receive daily updates.